Views the results from ComparativeMarkerSelection
Author: Marc-Danie Nazaire, The Broad Institute
Contact:
gp-help@broadinstitute.org
Algorithm Version:
The ComparativeMarkerSelectionViewer provides tools for reviewing and working with ComparativeMarkerSelection results. These tools include plots, a data table, expression profiles, filters, and creating dataset and feature list files. (A feature list is a text file with one feature per line.)
ComparativeMarkerSelectionViewer is an interactive tool. For non-interactive access to annotations, heatmaps, and creation of datasets and features lists, see the HeatMapImage, and ExtractComparativeMarkerSelection modules.
Heatmap/Plots
Heatmap and plots are displayed in the upper portion of the viewer. Use the View menu to select the plot to display:
- Heatmap (initially displayed) is a heatmap of the expression values sorted by the test statistic value.
- Upregulated Features plots the descending test statistic values versus features sorted by the test statistic value. This plot is useful for visualizing the number of features that have a positive and negative test statistic value in each class.
- Custom plots provide a pair-wise comparison of different statistics. To display custom plots click View > Custom Plot. To compare different significance measures: use the drop-down lists below the plot to select the measures to display on the X and Y axes and click Update. The viewer updates the plot and to reflect the new comparison.
- Histograms show the null distributions for each measure of significance.
- Use the following File> Save Image menu item to save the heatmap or plot. When saving a heatmap the currently visible rows will be saved by default. Optionally the entire heatmap can be saved by selecting include all features and samples. There is a limit on the size of the heatmap when saving in PNG format. The limit is roughly (number of features * number of samples <= 3580000).
Zoom in/out of plots
Use the mouse to click-and-drag over the plot area to zoom in.
Use the Reset button (upper right of plot) to return the zoom to the default level.
Note: Zoom in/out not available for heatmap.
Data Table
The table in the lower portion of the viewer lists the ComparativeMarkerSelection results. For a description of each column, see the ComparativeMarkerSelection documentation. By default, the features in the table are ordered by score. To reorder the features, click the title of the key column; for example, to order features by rank, click Rank.
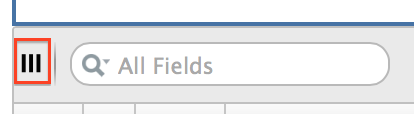
To choose which columns are shown in the table, click the Column Show/Hide toggle icon in the top-left corner of the table, just to the left of the search bar:
Using File>Save Table, you can export the table in tab delimited format for use in external programs such as Excel. This will result in a tab-delimited file with the contents of the table, leaving out any items excluded due to filters or columns hidden through the Column Show/Hide toggle.
Expression Profiles
The expression profile for a feature plots expression value per sample. A heatmap shows the same information, but color codes the expression values from red for the highest expression values through blue for lowest expression values.
To display an expression profile:
- Select one feature from the data table.
- Click View>Profile.
Filters
Use filters to display only features that you are interested in:
- Select Edit>Filter Features>Create/Edit Filters. The Filter Features window appears.
- In the Filter Features window, set your filtering criteria and click OK. The viewer will then only show those features that meet your criteria.
- To redisplay all features, select Edit>Remove All Filters.
Creating Datasets/Feature Lists
You can use the viewer to create a new dataset in GCT format or a feature list (a text file with one feature per line) containing a listing of the selected features in the table in from the ComparativeMarkerSelection results:
- Select the desired features from the table.
- Select File>Save Dataset or File>Save Feature List. A window appears.
- Choose a location and name for the new dataset/feature list.
- Click OK to save the new data set/feature.
References
Gould et al. Comparative Gene Marker Selection suite. Bioinformatics Advance Access published on May 18, 2006, DOI 10.1093/bioinformatics/btl196.
Parameters
| Name | Description |
|---|---|
| comparative marker selection filename * | The output from ComparativeMarkerSelection |
| dataset filename * | The dataset file used as input to ComparativeMarkerSelection |
* - required
Input Files
- comparative marker selection filename
The output file from ComparativeMarkerSelection in ODF format. - dataset filename
The dataset file used as input to ComparativeMarkerSelection in GCT format.
Platform Dependencies
Task Type:
javascript
CPU Type:
any
Operating System:
any
Language:
HTML, JQuery
Version Comments
| Version | Release Date | Description |
|---|---|---|
| 8 | 2017-06-06 | New Java Script module - replaces previous Java Applet visualizer |
| 7 | 2015-03-17 | Fix for SecurityException when saving datasets |
| 6 | 2014-07-28 | Added filter by multiple criteria, hide table columns, export table. Fixed for use with Java 7. Many other improvements and bug fixes. |
| 5 | 2013-09-20 | Added filter by rank, filter by multiple criteria, hide table columns, export table. Fixed for use with Java 7. Many other improvements and bug fixes. |
| 4 | 2006-07-29 | Updated GeneCruiser library |
| 3 | 2006-03-09 | Updated to work with latest ComparativeMarkerSelection module |
| 2 | 2005-06-13 | Added maxT p-value and removed rank p-value |