See the video tutorial: Getting Started (5 minutes)
Note that this video tutorial was created with GenePattern 3.2
The GenePattern Tutorial introduces you to GenePattern by providing step-by-step instructions for analyzing gene expression. It takes approximately 40 minutes to complete.
Note that this hands on tutorial was created with GenePattern 3.8.0
All of the information you need to successfully complete this tutorial is contained in the tutorial. For users who like additional discussion along the way, the tutorial includes pointers to more information in other GenePattern guides. Feel free to follow these links or to ignore them, depending on your learning style.
Introduction
Prerequisites
To follow the hands-on instructions in this tutorial, you must have access to the following:
- A GenePattern server, such as the public GenePattern server available at https://cloud.genepattern.org/.
- The server must have the following GenePattern analysis modules installed: ComparativeMarkerSelection, ComparativeMarkerSelectionViewer, ExtractComparativeMarkerSelection, and HeatMapViewer.
- The following example data files: all_aml_train.gct, all_aml_train.cls, all_aml_test.gct, and all_aml_test.cls.
Scientific Scenario
The gene expression dataset used in the tutorial is from Golub and Slonim et al. (1999), which used clustering and prediction algorithms to find genes that distinguish between two subtypes of leukemia, ALL and AML. The dataset consists of 38 bone marrow samples (27 ALL, 11 AML) obtained from acute leukemia patients.
For the purposes of this tutorial, your goal is to identify marker genes for the two subtypes of leukemia:
- You use the ComparativeMarkerSelection (version 9) analysis to find the genes in the dataset file that are most closely correlated with the two subtypes of leukemia.
- You use the ComparativeMarkerSelectionViewer (version 4) to examine the results of that analysis.
- You use the ExtractComparativeResults (version 3) analysis to create a new dataset that contains the marker genes that you have identified.
- You use the HeatMapViewer (version 10) to examine the expression levels of the marker genes and to confirm that the marker genes are clearly differentially expressed in the two subtypes of leukemia.
Note: If you are using a different version of any analysis, follow the instructions as closely as possible, but be aware that your results might not match those shown in the tutorial.
Starting GenePattern
To start GenePattern:
- Open a web browser, such a Firefox, Chrome, or Safari.
- Enter the URL of the GenePattern server that you want to use. For example, to use the public GenePattern server, enter https://cloud.genepattern.org/.
The login page appears. - Enter your user name and password. If you do not have a GenePattern account, select Click to register.
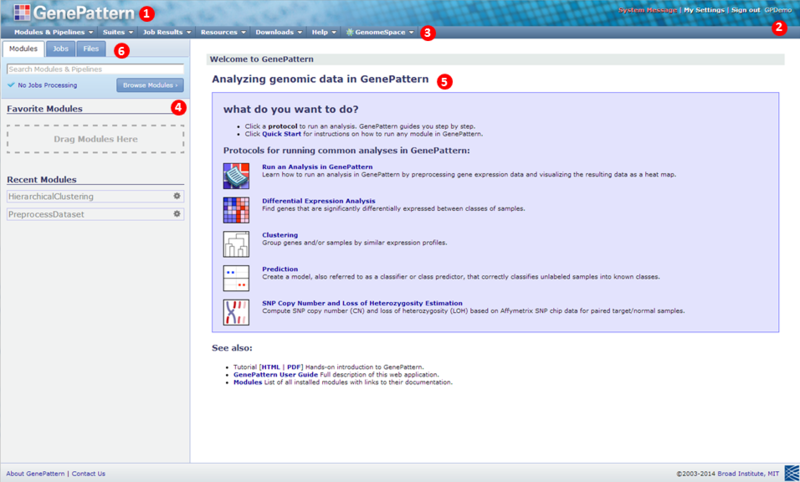
Whether a GenePattern server requires passwords depends on how it is configured. The public GenePattern server requires passwords. By default, a local GenePattern server does not. - Click Sign In. The GenePattern home page appears.
Note: Your home page may look slightly different depending on your GenePattern server, browser, and operating system. For this picture, we are using out public GenePattern server, Chrome and Windows 7.
 |
Click the GenePattern icon to return to this home page at any time. |
 |
The upper right corner shows your user name. |
 |
The navigation bar provides access to other pages. |
 |
The Modules & Pipelines provides access to the analyses that you can run. Enter the first few characters of a module or pipeline name in the search box to locate that analysis. Click the Browse Modules button to list them alphabetically, by category or by suite. You will also find your Favorite Modules in this panel, as well as Recent Modules you have used. |
 |
The center pane is the main display pane, which GenePattern uses to display information and to prompt you for input. |
 |
The Jobs tab lists the most recent analyses that you have run and their results files. The Files tab lists files that you have copied to the GenePattern server. When you start GenePattern for the first time, these tabs are empty. |
For more information: see User Interface in the GenePattern User Guide.
Running Analyses
Now that you have started GenePattern, you are ready to analyze your data. In this section, you learn how to:
- Run the ComparativeMarkerSelection analysis to find marker genes -- the genes in the dataset that are most closely correlated with the two phenotypes (ALL and AML) in the dataset.
- Run the ComparativeMarkerSelectionViewer to examine the ComparativeMarkerSelection analysis results.
- Run the ExtractComparativeResults analysis to create a smaller dataset that contains only the marker genes.
- Run the HeatMapViewer to examine the expression levels of the marker genes.
Running ComparativeMarkerSelection
Run the ComparativeMarkerSelection analysis to find the genes in the dataset that are most closely correlated with the two phenotypes (ALL and AML) in the dataset. To run the ComparativeMarkerSelection analysis:
- In the Modules & Pipelines panel, click "Browse Modules", select Gene List Selection, and then select the ComparativeMarkerSelection analysis. Alternatively, type the first few characters of the module name into the search box to quickly locate the module and then select it. GenePattern displays the ComparativeMarkerSelection parameters.
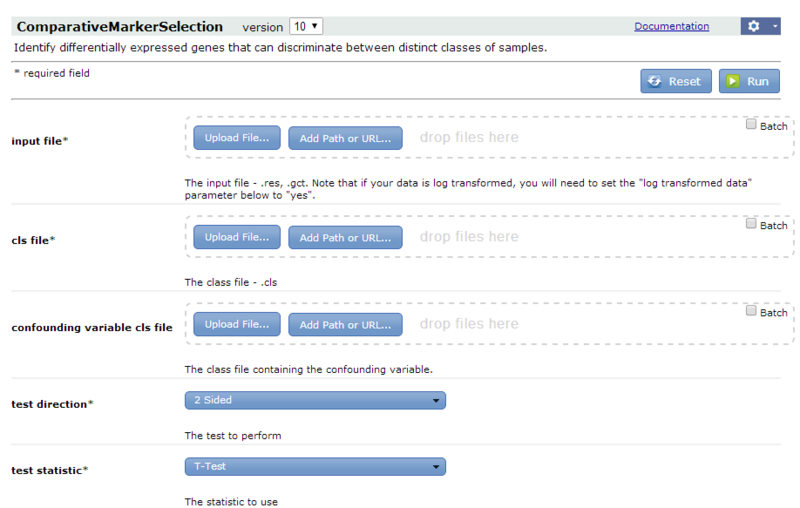
- For information about the module and its parameters, click Documentation.
- For the input file parameter, select
all_aml_train.gct(https://datasets.genepattern.org/data/all_aml/all_aml_train.gct).- To use a downloaded copy of the file, drag it from your file system and drop it on the input file parameter.
- To use the file URL, select the Add Path or URL button, enter the URL of the file, and click Select.
- For the cls filename parameter, select
all_aml_train.cls(https://datasets.genepattern.org/data/all_aml/all_aml_train.cls). - Click Run to start the analysis. GenePattern sends the analysis job to the server and displays the Job Status page. After a minute or two, the status icon changes from running
 to complete
  . (for information on the Pending state see the 3.9.0 release notes)
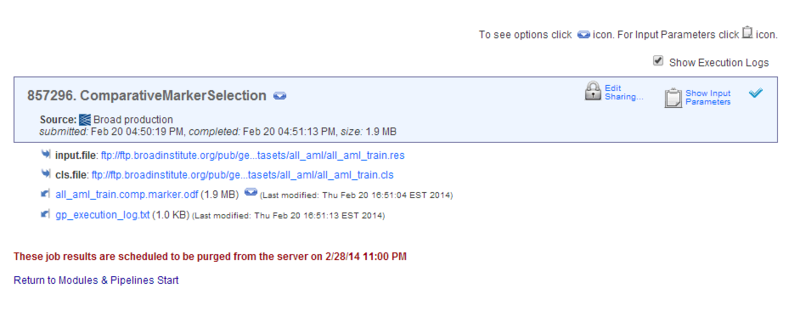
Analysis results are stored on the GenePattern server. The text shown in red tells you when the analysis results will be deleted. To save your analysis results, copy the files from the GenePattern server to your own directories, as described later in this tutorial. - Click Return to Modules & Pipelines Start to return to the home page.
For more information: see Running Modules and Pipelines.
Reviewing Result Files
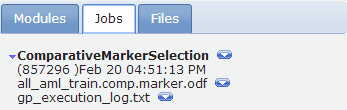
When you return to the GenePattern home page, the Jobs tab shows the analysis job that you ran and the associated analysis results files:
- Click the job name or number. GenePattern redisplays the status page. On the Job Status page, click Return to Modules & Pipelines Start to return to the home page.
- Click the icon next to the analysis job to display commands that you use to work with the job:
Download Downloads a zip file containing all analysis results files for this job. Reload Displays the analysis and its parameters, with the parameters set to the values used for this analysis job. Delete Deletes the analysis job and its analysis results files from the GenePattern server. Info Displays the parameter values and the analysis results files for this job. View Java Code
View MATLAB Code
View R CodeDisplays the command line that you would use to run this job in the Java, MATLAB, or R programming environments. These commands are useful for programmers who want to access GenePattern from one of these programming environments or from their own applications. - Click the icon next to an analysis results file to display commands that you use to work with the file:
Delete Deletes the file from the GenePattern server. Save Downloads the file from the GenePattern server. Create Pipeline Creates a GenePattern pipeline that reproduces this analysis results file. Pipelines are discussed later in this tutorial. List of analyses Lists analyses that commonly use this type of file as an input parameter.
Select an analysis to display its parameters with this results file specified as the first input parameter. - Click the analysis results file,
all_aml_train.comp.marker.odf, to display it in a text viewer. The amount of information it contains makes the file difficult to understand. This file, like most analysis results file, is not intended to be viewed as a text file, but rather intended to be used as input to subsequent analyses. - Click the Back button in your web browser to return to the home page.
For more information: see Working with Analysis Results
Running the ComparativeMarkerSelectionViewer
After running the ComparativeMarkerSelection analysis, run the ComparativeMarkerSelectionViewer to examine the analysis results. To run the ComparativeMarkerSelectionViewer:
- In the Jobs tab, click the
 icon next to your
 all_aml_train.comp.marker.odfresults file. - Select ComparativeMarkerSelectionViewer. GenePattern displays the ComparativeMarkerSelectionViewer parameters. The comparative marker selection filename parameter is automatically set to the
all_aml_train.comp.marker.odfresults file. - For the dataset filename parameter, select the
all_aml_train.gctfile (https://datasets.genepattern.org/data/all_aml/all_aml_train.gct).
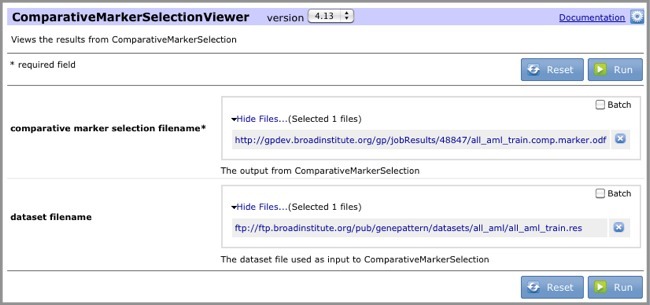
- Click Run. GenePattern displays the Job Status page.
- If the security message appears, accept the risk and click Run to continue.
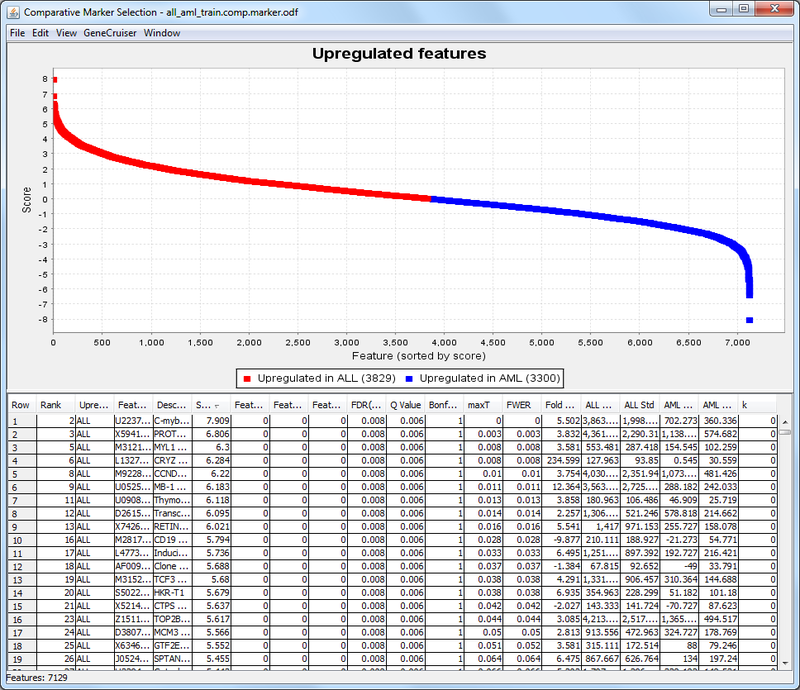
The ComparativeMarkerSelectionViewer appears:
- In the ComparativeMarkerSelectionViewer:
- The Score column shows the value of the metric used to correlate gene expression and phenotype. A high score indicates correlation with the first phenotype (upregulated in ALL) and a low score indicates correlation with the second phenotype (upregulated in AML).
- The middle columns, FDR through FWER, provide different ways to measure the significance of the score. The lower the value the more significant the result. For example, you might choose to measure significance using the false discovery rate (FDR) and set a significance cutoff of FDR < .05. Using this measure, you would focus on genes with the lowest and highest scores, where the measure of significance for the score was an FDR < .05.
- In GenePattern, click Return to Modules & Pipelines Start to return to the home page.
Running ExtractComparativeMarkerResults
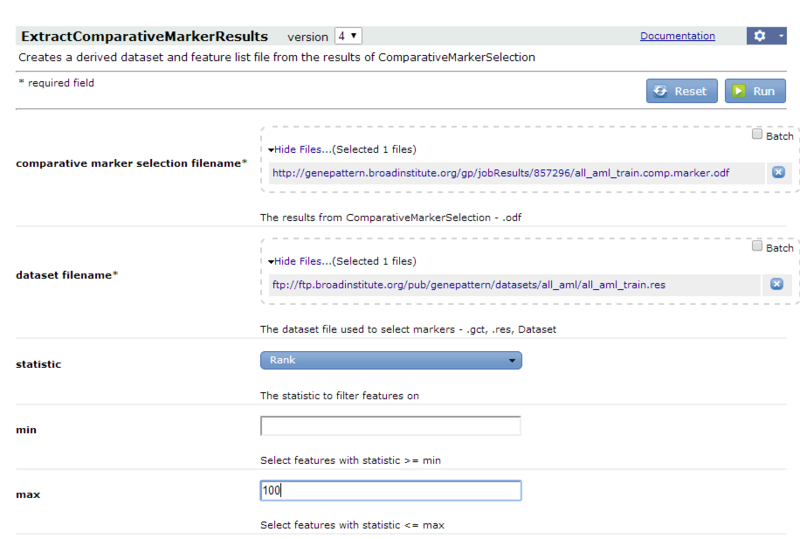
Now that you have examined the ComparativeMarkerSelection analysis results, you want to create a new dataset that contains only the most promising marker genes from the results file for further analysis. To run the ExtractComparativeResults analysis:
- In the Jobs tab, click the icon next to the ComparativeMarkerSelection results file,
all_aml_train.comp.marker.odf. - Select ExtractComparativeMarkerResults. GenePattern displays the ExtractComparativeMarkerResults parameters. The comparative marker selection filename parameter is automatically set to the
all_aml_train.comp.marker.odfresults file. - For the dataset filename parameter, select the
all_aml_train.gctfile (https://datasets.genepattern.org/data/all_aml/all_aml_train.gct). - Enter the following parameter values to extract the top 100 features (genes) in the analysis results file:
- For the statistic parameter, select Rank.
- For the max field, enter 100.
- Click Run. GenePattern displays the Job Status page. After a few seconds, the status icon changes from running
 to complete
  and GenePattern displays the analysis results files. (for information on the Pending state see the 3.9.0 release notes)
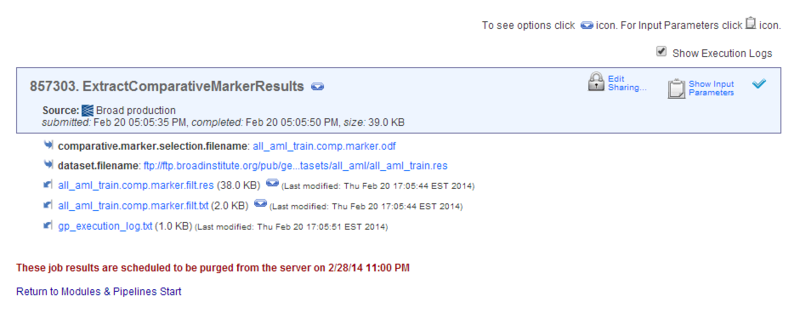
- Leave the Job Status page displayed.
Running HeatMapViewer
The HeatMapViewer displays expression values in a color-coded heat map. The largest expression values are displayed in red (hot) and the smallest values are displayed in blue (cool). Intermediate values are displayed in different shades of red and blue. The color-coding provides a quick coherent view of gene expression levels.
To display your new dataset in the HeatMapViewer:
- On the Job Status page, click the icon next to the results file from the ExtractComparativeMarkerResults analysis,
all_aml_train.comp.marker.filt.gct. - Select HeatMapViewer. GenePattern displays the HeatMapViewer parameters. The dataset parameter is automatically set to the
all_aml_train.comp.marker.filt.gctresults file.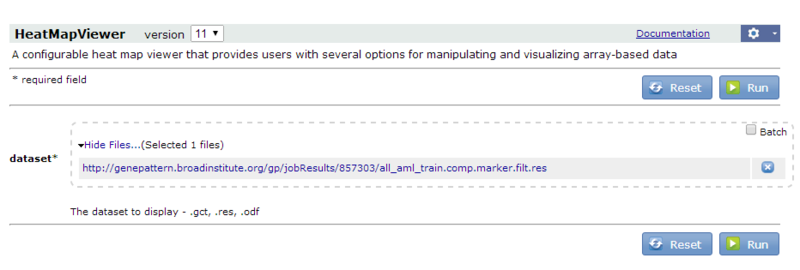
- Click Run. The HeatMapViewer appears.
- In GenePattern, click the GenePattern icon in the upper left to return to the home page.
Using Pipelines
As you have seen, GenePattern makes it easy to run individual analyses and to review analysis results. Pipelines take this one step further: they make it easy to run multiple analyses. You can define a pipeline to run multiple analyses against a single dataset or to run a sequence of analyses, where the output from one analysis becomes the input for a subsequent analysis. Modules run from a pipeline work exactly the same as those run directly from GenePattern.
In this tutorial, you have run two analyses: ComparativeMarkerSelection and ExtractComparativeMarkerResults. The analysis results file from the first analysis became the input file for the second analysis. Running these two analyses produced a new dataset that contains the 100 genes in your dataset (all_aml_train.gct) that are most closely correlated with phenotypes in your class file (all_aml_train.cls).
In this section, you will:
- Create a pipeline that duplicates your analysis results.
- Edit the pipeline so that it operates on any set of data (gct and cls) files.
For more information: see Working with Pipelines in the GenePattern User Guide.
See the video tutorial: Exploring the New GenePattern Pipeline Designer
Creating a Pipeline Based on Previous Results
You can create a pipeline in one of three ways:
- Clone an existing pipeline.
- Create an empty pipeline and then add to it the analysis modules that you want the pipeline to run.
- Create a pipeline based on an analysis results file. In this case, GenePattern uses the following logic to add to the pipeline the analysis modules required to reproduce the analysis results file: add the module that created the result file; check the module’s input file parameters; if the input file for the module was the output file of a previous module, add the previous module; check that module’s input file parameters; continue to walk back through the chain of modules, adding modules to the pipeline, until reaching the initial input file.
In this tutorial, you want to create a pipeline based on the ExtractComparativeMarkerResults results file:
- In the Jobs tab, click the icon next to the results file from the ExtractComparativeMarkerResults analysis,
all_aml_train.comp.marker.filt.gct. - Select Create Pipeline. GenePattern displays the new pipeline in the pipeline designer.
In this section, you first explore the pipeline designer and then examine the content of the pipeline.
Pipeline Designer
Each time you create or edit a pipeline, GenePattern displays the pipeline designer:
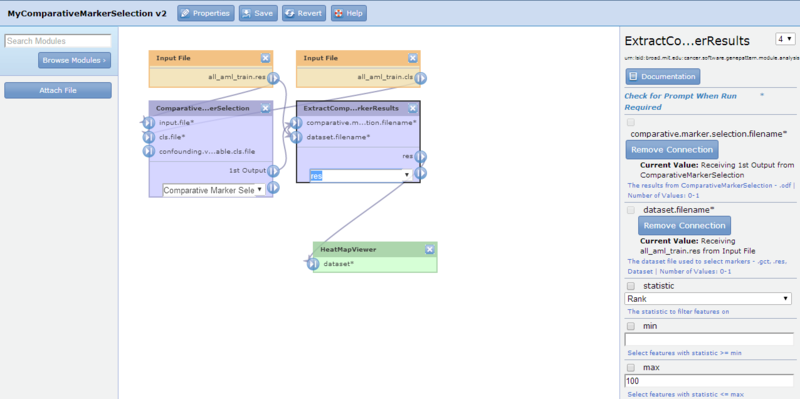
The pipeline designer comprises three main parts (from left to right):
- Module selection panel. Use this panel to add a module or a file to the pipeline.
- Pipeline diagram. The center panel displays the pipeline diagram. It shows each module in the pipeline, as well as any input files included in the pipeline. Connections between the modules show the flow of data through the pipeline. Click-and-drag to reposition modules/files and to add connections between modules/files.
- Editing panel. Use the editing panel to view and edit basic pipeline properties (as shown here) or the properties of the object selected in the diagram.
At the top of the pipeline designer, the toolbar provides the following options:
 |
Displays the basic pipeline properties in the Editing Pipeline panel, as shown here. |
 |
Saves your changes without closing the designer, and provides the option to run after saving. |
 |
Loads the last saved version of the pipeline, overwriting any unsaved changes. |
 |
Displays the pipeline designer section of the GenePattern documentation. |
Pipeline Content
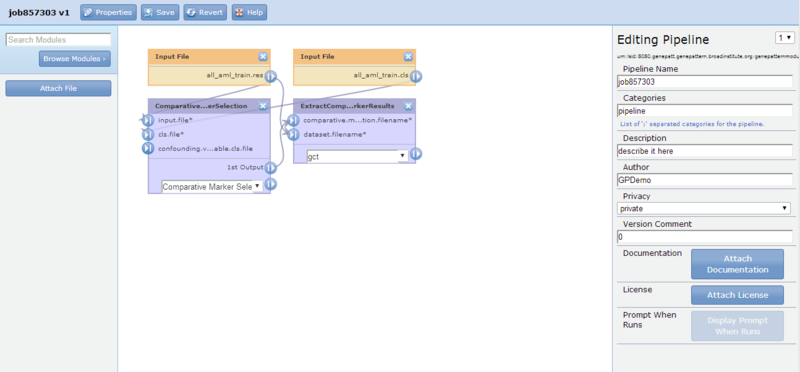
The pipeline displayed in the pipeline designer reproduces the ExtractComparativeMarkerResults analysis results file:
-
The ComparativeMarkerSelection module has two input files. As shown by the connections in the diagram, the
all_aml_train.gctfile is the input for the input.file parameter and theall_aml_train.clsfile is the input for the cls.file parameter. -
The ExtractComparativeMarkerResults module also has two input files. The odf output file of the ComparativeMarkerSelection module is the input for the comparative.marker.selection.filename parameter and the
all_aml_train.gctfile is the input for the dataset.filename parameter.
Click the ExtractComparativeMarkerResults module to display its parameters in the editing panel. Note that all of the parameters are set to the values you used when you initially ran the module; in particular, statistic=rank and max=100.
Editing Pipeline Properties
To edit pipeline details:
- Click to display the basic pipeline properties in the editing panel. By default, the pipeline name is the job number.
- Change the pipeline name to MyComparativeMarkerSelection by editing the Pipeline Name field.
- Provide a category for your pipeline. It can remain in the pipeline category, be move to another category, or be in 2 or more categories. For this tutorial, add the category "Gene List Selection", as shown in the image below.
- Enter a brief description for your pipeline and, if you would like, edit the author field to include your email address.
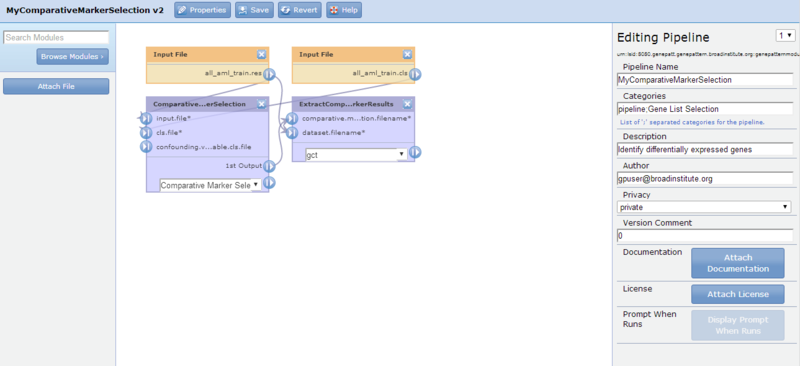
- Click to save your changes. Each time you save the pipeline, you create a new version of the pipeline.
When GenePattern displays the Pipeline Saved confirmation window, click Close to close the window.
Adding Modules to a Pipeline
The pipeline contains the two analysis modules used to create the analysis results file: ComparativeMarkerSelection and ExtractComparativeMarkerResults. In your original analysis, after creating the analysis results file, you used the HeatMapViewer to review the results.
To add the HeatMapViewer module to your pipeline:
- In the module selection panel (to the left of the diagram), click Browse Modules, select Viewer, and then HeatMapViewer. GenePattern adds the module to the pipeline diagram. You may need to scroll the diagram to see the module.
- Click-and-drag the HeatMapViewer module to position it below the ExtractComparativeMarkerResults module. Selecting the HeatMapViewer module displays its parameters in the editing panel. The editing panel displays a warning indicating that you have not yet set the required dataset parameter.
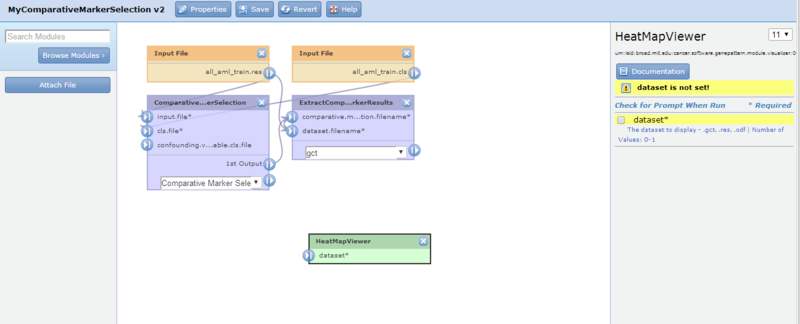
- You want the GCT output file of the ExtractComparativeMarkerResults module to be the input file for dataset parameter of the HeatMapViewer module. So, first you want to select res in the output file format drop-down, then you want to draw a connection from the output file to the input parameter. To draw the connection, click-and-drag from the
 icon next to the GCT output file of the ExtractComparativeMarkerResults module to the
  input icon next to the dataset parameter of the HeatMapViewer module. GenePattern updates both the diagram and the editing panel:
- Click
 to save your changes and then run the pipeline. GenePattern creates a new version of the pipeline, closes the pipeline designer, and displays the pipeline run page.
Running the Pipeline
To run the pipeline:
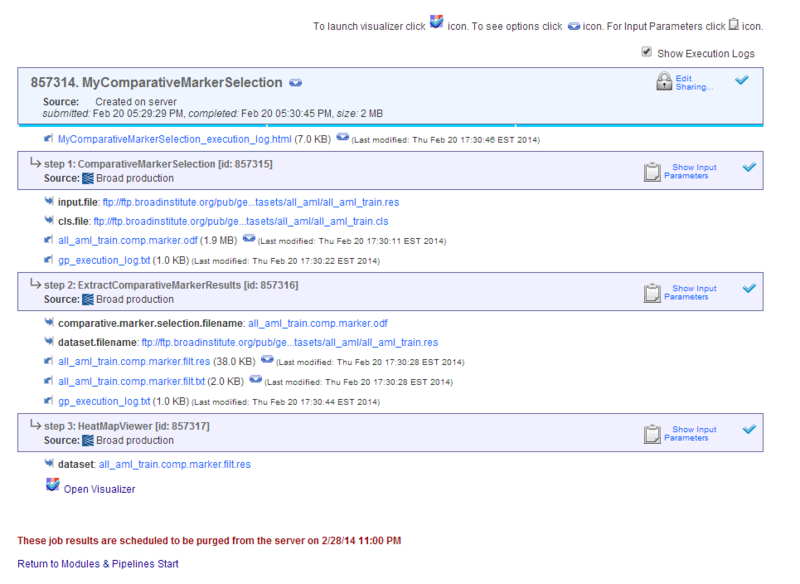
- Click Run. GenePattern displays the Job Status page, runs each module, and displays the analysis results.
- Close the HeatMapViewer.
- In GenePattern, click the GenePattern logo in the upper left to return to the home page.
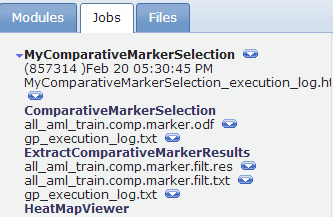
The Jobs tab shows the pipeline job, which lists each analysis run and its analysis result files.
Adding Parameters to a Pipeline
You have created a pipeline that duplicates your original analysis: it runs the Comparative Marker Selection analysis on the all_aml_train data (gct and cls) files, uses the analysis results as input to the Extract Comparative Marker Results analysis, and then displays the analysis results using the Heat Map Viewer.
You can make the pipeline more generally useful by having it prompt you for the data (gct and cls) files to be analyzed, rather than simply analyzing the all_aml_train data files. To do this, mark the input file parameters as prompt-when-run. When GenePattern runs the pipeline, it will prompt the user to enter values for the prompt-when-run parameters.
To edit the pipeline:
- In the search box at the top of the Modules & Pipelines pane, enter the first few characters of your pipeline name. GenePattern lists module names that contain those characters.
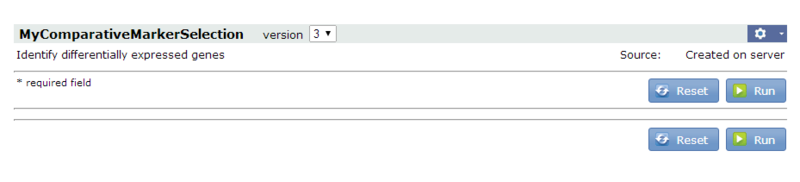
- Select your pipeline. GenePattern displays the pipeline run page:
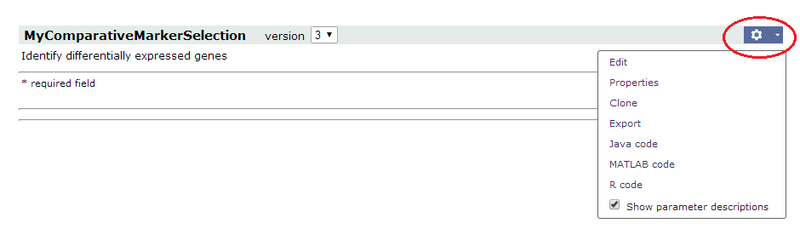
- Click Edit. GenePattern displays the pipeline designer.
To add parameters to the pipeline, mark the parameters of interest as prompt-when-run:
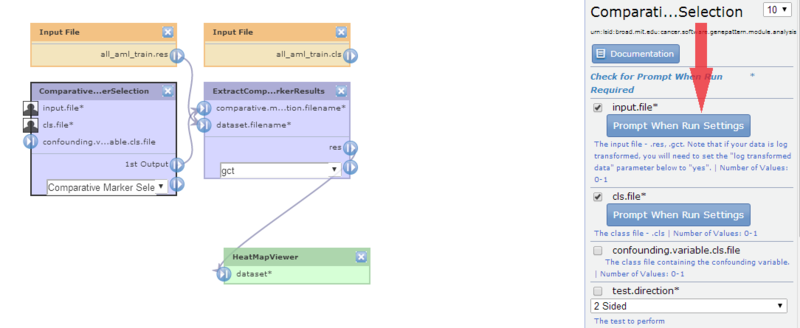
- Click ComparativeMarkerSelection to display its properties:
The input.file parameter is set to all_aml_train.gct.
The cls.file parameter is set to all_aml_train.cls.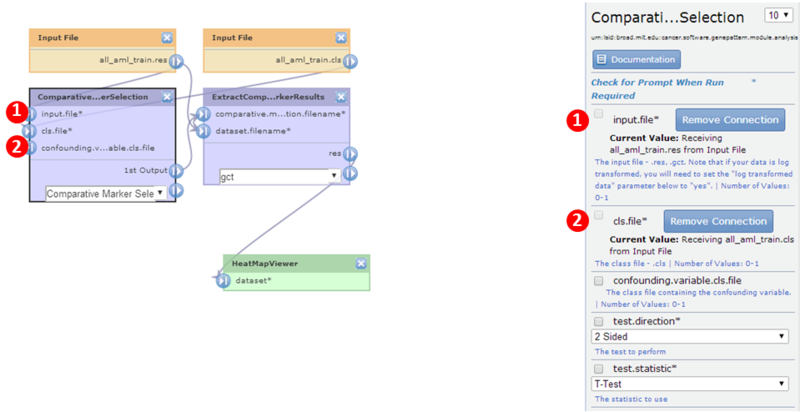
- Modify the input.file parameter to mark it prompt-when-run:
In the editing panel:
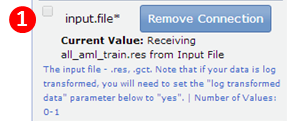
- Click the Remove Connection button next to the input.file parameter. GenePattern updates both the diagram and the editing panel.
- Click the prompt-when-run checkbox next to the input.file parameter. GenePattern updates both the diagram and the editing panel.
- Optionally, click the Set Prompt When Run Display Settings button to change the text GenePattern will use to prompt the user for input.
- Modify the cls.file parameter to mark it prompt-when-run. This time, you will use the diagram to edit the parameter:
- In the diagram, click the icon next to the cls.file parameter.
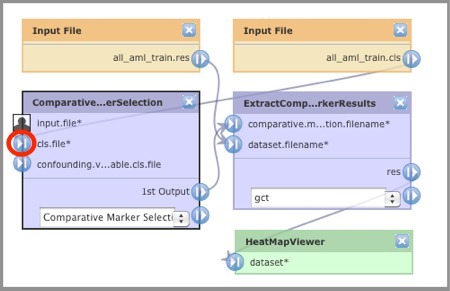
GenePattern displays the Choose Action window:
- Click Remove Connection. GenePattern updates both the diagram and the editing panel.
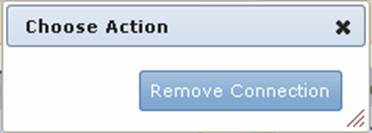
- In the diagram, again click the icon next to the cls.file parameter. GenePattern displays the Choose Action window:
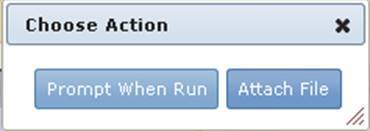
- Click Prompt When Run. GenePattern updates both the diagram and the editing panel.
- In the editing panel, optionally, click Set Prompt When Run Display Settings to change the text GenePattern will use to prompt the user for input.
- In the diagram, click the
- Click ExtractComparativeMarkerResults to display its properties. The dataset.filename parameter is set to
all_aml_train.res. - Remove the connection between the dataset.filename parameter and the
all_aml_train.gctfile, and then modify the dataset.filename parameter to mark it prompt-when-run.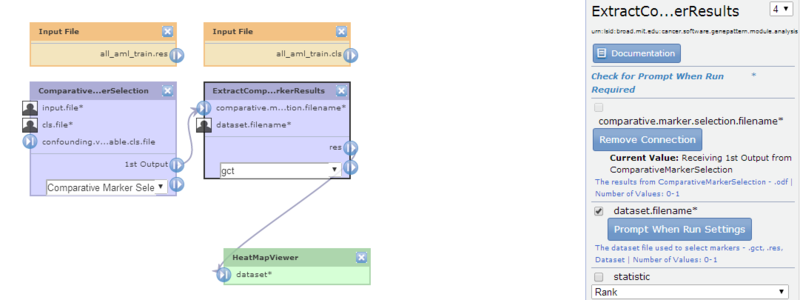
- Click to save your changes and run the pipeline. GenePattern creates a new version of the pipeline, closes the pipeline designer and displays the pipeline run page.
Running the Edited Pipeline
When you save and run the pipeline, GenePattern displays the pipeline parameters (if any):
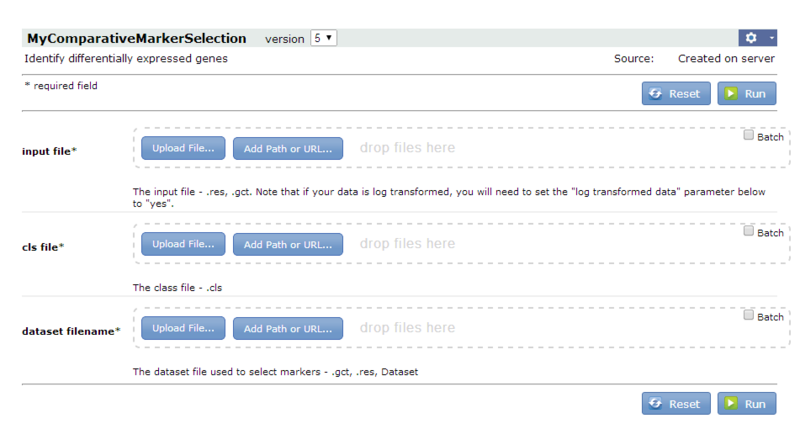
To run the edited pipeline:
- For the input file parameter, select
all_aml_train.gct(https://datasets.genepattern.org/data/all_aml/all_aml_train.gct). - For the cls file parameter, select
all_aml_train.cls(https://datasets.genepattern.org/data/all_aml/all_aml_train.cls). - For the dataset filename parameter, select
all_aml_train.gctagain (https://datasets.genepattern.org/data/all_aml/all_aml_train.gct). - Click Run. The Status page appears and GenePattern runs each module. After a few moments, GenePattern displays the HeatMapViewer.
- Close the HeatMapViewer.
- In GenePattern, click Return to Modules & Pipelines Start to return to the home page.
The pipeline requires that you enter the same data file (all_aml_train.gct) twice: once for the input file parameter of the ComparativeMarkerSelection module and again for the dataset filename parameter of the ExtractComparativeMarkerResults module. Ideally, you want to enter the data file once and have the pipeline use it for both the ComparativeMarkerSelection and ExtractComparativeMarkerResults modules. For more information on how that can be done, see Reusing a User-Supplied File in the Working With Pipelines section of the GenePattern User Guide.
Saving and Deleting Result Files
As described earlier in the tutorial, analyses are run on the GenePattern server and analysis results files are stored on the server. Server storage is temporary and analysis results files are deleted after they have been on the server for a certain length of time (by default, one week).
To save your analysis results files, you must copy each file from the server to a more permanent location. If you do not need your analysis results, you can delete them at any time.
To save an analysis results file:
- In the Recent Jobs pane, click the icon next to a results file.
- Click Save.
To delete an analysis results file:
- In the Recent Jobs pane, click the icon next to a results file.
- Click Delete.
To save or delete a job and all of its analysis results files, click the icon next to the job and click Download or Delete.
Exiting from GenePattern
To exit from GenePattern, click the Sign out link in the top right corner of the title bar and then close the web browser window.
Learning More About GenePattern
Thank you for taking this time to learn about GenePattern!
As you continue to work with GenePattern, please explore the rest of the site.
We welcome your feedback. If you have suggestions, comments, or questions please visit our forum .