Spatial transcriptomics (ST) is transforming biological research by allowing scientists to map gene expression within tissue architecture, revealing critical insights into cellular organization and interactions. However, the complexity of ST data analysis—requiring programming skills and bioinformatics expertise—poses a barrier for many researchers.
GenePattern provides support for the visualization and analysis of spatially-resolved transcriptomics data, such as those generated with 10X Visium or NanoString CosMx, through the release of the spatialGE modules.
To address this challenge, spatialGE provides a user-friendly, open-source solution that simplifies ST data exploration. Designed for accessibility, spatialGE integrates key analytical workflows, including quality control, normalization, domain detection, phenotyping, and spatial analysis, enabling researchers to uncover biologically meaningful patterns with minimal computational expertise.
The tools have been successfully applied to study the tumor microenvironment, identifying spatial gene expression patterns in melanoma metastases and Merkel cell carcinoma samples. By detecting distinct tissue domains, characterizing spatial heterogeneity, and facilitating comparative analysis across samples, spatialGE supports deeper insights into disease mechanisms and cellular interactions.
The following modules are provided.
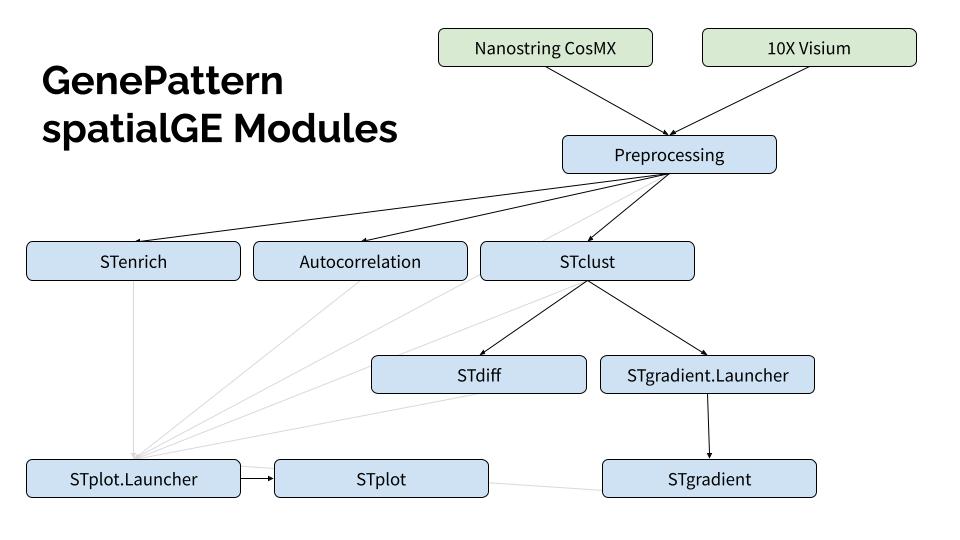
spatialGE.Preprocessing
Performs data ingestion, filtering, transformation, and pseudobulk operations to prepare data for downstream analysis in platforms such as GeoMx, Visium, and CosMx-SMI.
- Please refer to the spatialGE.Preprocessing documentation.
spatialGE.STplot
Generates plots displaying gene expression, cluster memberships and metadata within a spatial context.
Data should be sent to the module spatialGE.STplot.Launcher, which prompts the user for more input and
then launches an appropriately configured spatialGE.STplot analysis.
Accepts data from spatialGE.Preprocessing, spatialGE.STenrich, spatialGE.STclust
and spatialGE.STdiff.
- Please refer to the spatialGE.STplot.Launcher documentation.
- Also available is the spatialGE.STplot documentation.
spatialGE.SpatialAutocorrelation
Assesses the level of spatial uniformity in gene expression by calculating Moran’s I and/or Geary’s C and qualitatively explore correlations with sample-level metadata (i.e., tissue type, therapy, disease status). It is used to explore the relationship between a clinical (sample-level) variable of interest and the level of gene expression spatial uniformity within a sample.
- Please refer to the spatialGE.SpatialAutocorrelation documentation.
spatialGE.STenrich
Detects genes showing spatial expression patterns (e.g., hotspots) and tests if spots/cells with a high average expression of a gene set show evidence of spatial aggregation.
- Please refer to the spatialGE.STenrich documentation.
spatialGE.STclust
Performs clustering analysis on spatial gene expression data.
- Please refer to the spatialGE.STclust documentation.
spatialGE.STdiff
Performs differential expression analysis on spatial transcriptomics data. Identifies differentially expressed genes based on spatial and non-spatial models.
- Please refer to the spatialGE.STdiff documentation.
spatialGE.STgradient
Reads the output of spatialGE.STclust and then launches an analysis to test for genes for which there is
evidence of expression spatial gradients with respect to a "reference" tissue niche/domain (e.g., higher expression
closer to reference tissue niche, lower expression as farther from reference tissue niche).
Data should be sent to the module spatialGE.STgradient.Launcher, which prompts the user for more input and
then launches an appropriately configured spatialGE.STgradient analysis.
- Please refer to the spatialGE.STgradient.Launcher documentation.
- Also available is the spatialGE.STgradient documentation.